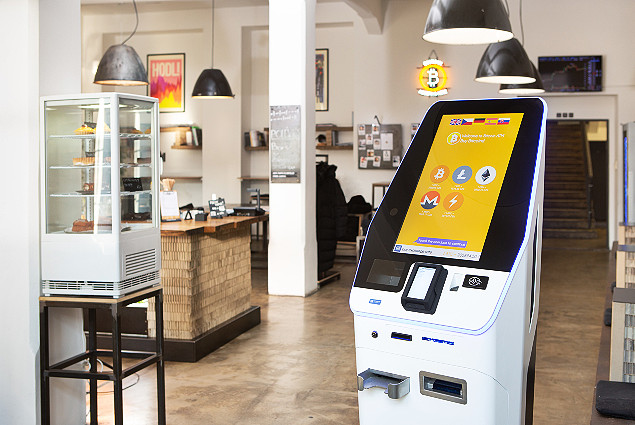
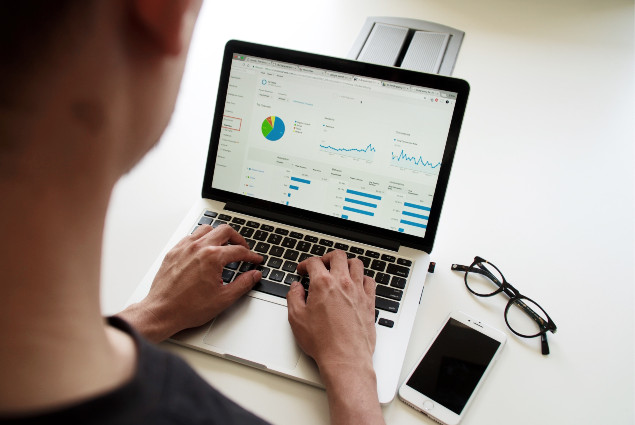
Understanding your customers’ behavior is crucial in today’s highly competitive business landscape. One valuable source of insights is the analytics data collected from interactive kiosks. These self-service stations scattered throughout your retail environment or exhibition stand are not just service provider. They’re also data gold mines.
This article will guide you through the interactive kiosk analytics metrics to pay attention to and how to leverage this data for your business strategies.
Tracking user sessions
Understanding how many people are interacting with your interactive information kiosk is a fundamental metric. User session data will provide a broad overview of the kiosk’s usage, letting you know whether your investment in the kiosk is paying off in terms of engagement.
You can track user sessions by day, time, and location if you have multiple kiosks. For example, if your kiosks are in various departments in a retail store, the electronics department kiosk has the most user sessions. This data can inform you about where to place promotional materials or how to distribute staffing resources.
Dwell time

Dwell time—the time a user spends interacting with the kiosk—is another critical metric. It can provide insights into how engaging and valuable the content on your kiosk is.
If users spend a lot of time on specific sections, those sections are likely meeting a need or interest. Conversely, a short dwell time could indicate interfaces or irrelevant content could be clearer. For instance, if a video tutorial has high dwell times, consider featuring it more prominently or creating similar content.
Popular content
Just like website analytics, tracking which features or sections of the kiosk are most used can provide invaluable insights. You’ll want to know which services or pieces of content are most attractive to your users.
Knowing the popular content, you can prioritize updates or additions to those sections. For instance, if a particular product catalog or informational video is getting a lot of views, you should enhance those sections with additional features or promotions.
Interaction flow
Understanding how users navigate your kiosk’s interface is critical to refining their experience. Interaction flow analytics can show you the common pathways users take.
Do users often move from the home page to a specific service? Do they abandon a particular task halfway through? If most users quit the interface after reaching the “Contact Us” page, you may want to simplify that section or provide improved instructions.
Making data-driven decisions
After gathering all this data, the next step is converting these insights into action. For instance, if you notice that dwell time is highest over the weekends, consider running special weekend promotions.
Consider placing your premium products or services there if the user sessions are highest in a particular kiosk location. If you are only considering getting kiosks for your business, learn about the best kiosk manufacturers.
Conclusion and future trends
As these kiosks become more advanced, so do interactive kiosk analytics capabilities. We are moving towards a future where Artificial Intelligence can offer predictive analytics, suggesting potential user pathways or personalizing the kiosk content based on past interactions.
Understanding kiosk analytics is not just about collecting data. It’s about transforming this data into actionable insights that align with your business objectives. The future is promising, and as analytics get smarter, so will our strategies

